
Why the Kelly Equation Fails in Real Trading — and how I adjusted it for my backtested strategies
What Is the Kelly Equation and Where Did It Come From?
John Kelly created this formula in 1956 to solve a very specific problem. He wanted to find the perfect bet size to grow money as fast as possible.
Blackjack players made Kelly famous. Card counters used it to calculate exactly how much to wager based on their edge over the casino.
From Blackjack to Trading: The Key Idea of Expected Value
Every bet has an Expected Value, or EV. EV tells you how much you earn on average each time you place that bet.
In blackjack, a card counter knows their EV precisely. A positive EV means betting more. A negative EV means walking away.
This is where retail traders hit a wall most people never talk about. You cannot know your EV until you have traded the same setup hundreds of times across different market conditions.
Every win and every loss is a data point. Those data points are built from real money, real stress, and real mistakes you make at 10am staring at a red screen.
Most traders never collect enough data to know their true edge. They change strategies after ten losing trades, which resets the entire learning process back to zero.
You only discover your real EV after you have been through enough pain to stop second-guessing the system. By then, the tuition fee has already been paid.
Why the Kelly Equation Fails in Real Trading: Three Broken Assumptions
Kelly assumes three things stay constant: your win rate, your bet size, and your risk reward ratio. Real markets break all three assumptions at the same time.
Your win rate shifts with market regimes. Your reward changes based on volatility. These three numbers rarely stay stable across an entire year.
Trading is nothing like card counting or betting on horses. In those games, you know exactly how much you can win before the hand is dealt. In trading, your upside has no ceiling.
This is why blindly following YouTube gurus who preach fixed one to one risk reward is so dangerous. The moment you cap your reward to match your risk, you are voluntarily cutting off the trade that pays for six months of losses.
Your best trade of the year is not a clean, repeatable setup. It is messy, uncomfortable, and bigger than anything you planned for. That is the fat tail. That is where real money is made.
A genuinely great stock setup does not show up like a factory pushing out candy on a conveyor belt. It is not there every morning. It is not there every week. Realistically, it visits you once a month if you are paying attention.
So if you treat trading like an office job, sitting at your desk waiting for the profit monster to clock in at 9am, you are not being disciplined. You are collecting bruises while calling it a strategy.
Markets Have Memory: The Problem Kelly Equation Completely Ignores
Blackjack hands do not affect each other. Trading days absolutely do.
Bear markets do not last one bad week. The 2007 crash kept pushing lower for over two years because bearish momentum feeds on itself.
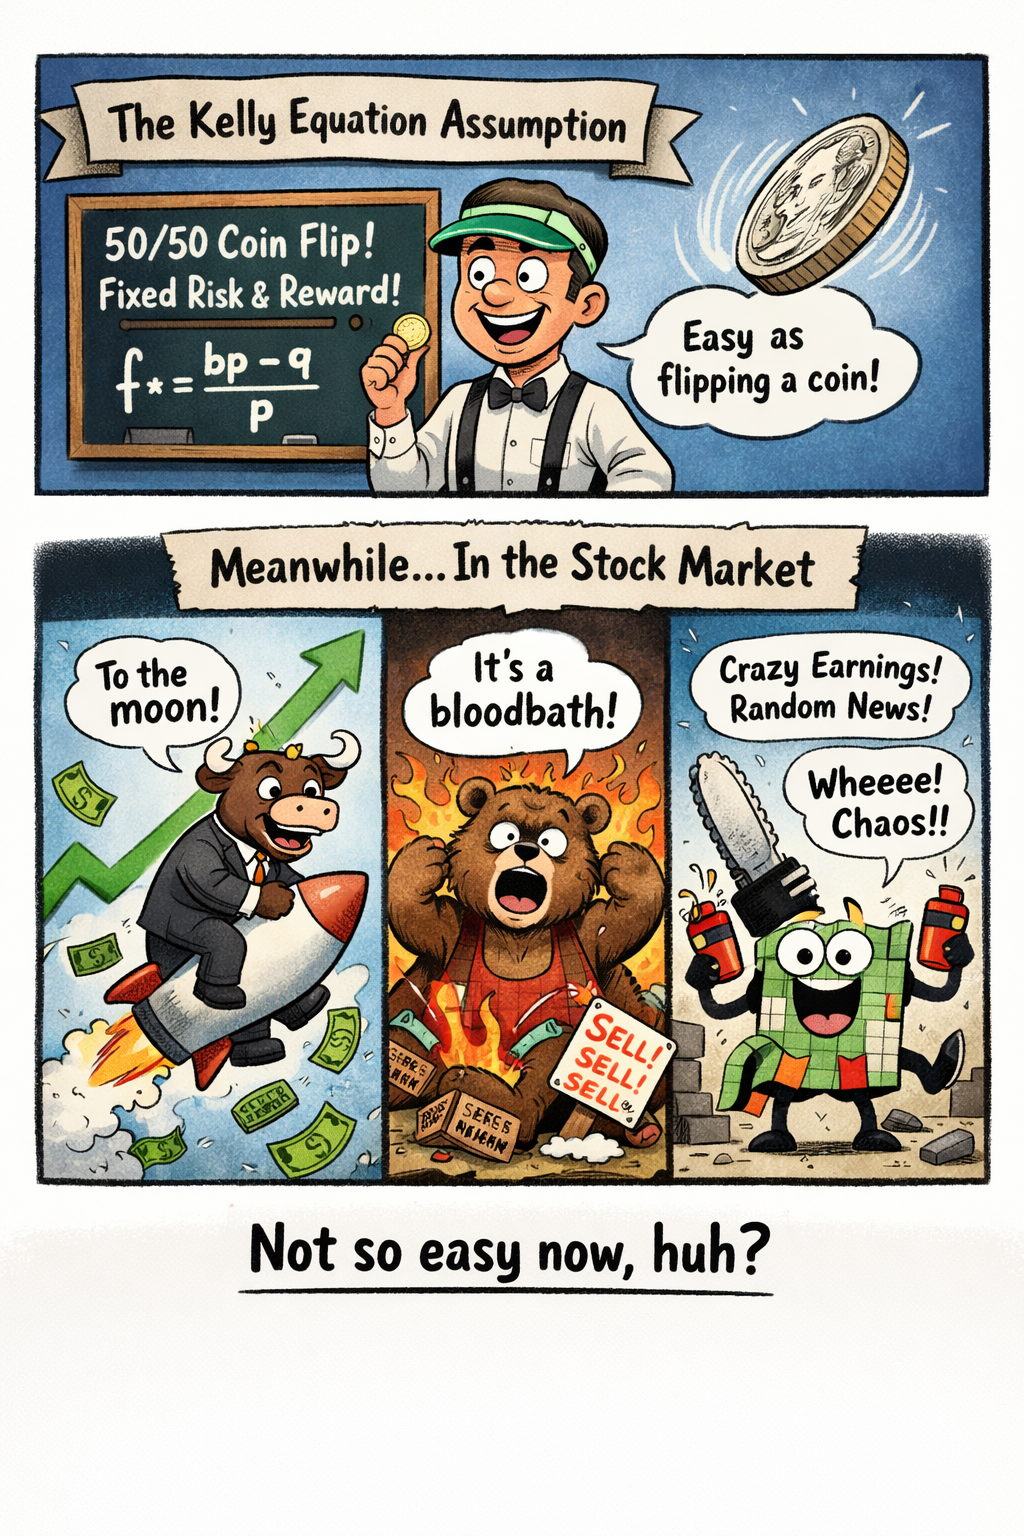
Most people picture Kelly as a coin flip model. Heads or tails, fifty fifty, clean and simple. But market sentiment has never worked that way and never will.
This is not a university professor walking you through a statistics textbook. Even in a perfectly fair coin flip, you can hit ten losses in a row and that is completely normal within the math. Markets are not fair coin flips. They are something far more unforgiving.
In a real bear market, a twenty trade losing streak is not a statistical anomaly. It is Tuesday. And when that streak ends, the damage does not stop either. The bleeding can continue for another two years without a single dramatic moment to point at.
The S&P 500 dropped 57% from its peak during the 2008 crash. That was not bad luck. That was institutional memory, forced selling, and fear compounding on top of more fear month after month.
Investors remember what happened three months ago. They remember six months ago. For prices to recover, the market does not just need good news. It needs consistently good news stacked on top of more good news for long enough that the memory of the crash starts to fade.
Stan Weinstein described this precisely. He argued that a genuine recovery only begins when the 30 week moving average starts trending upward. Not a bounce. Not a relief rally. Thirty weeks of sustained directional change before you can trust the trend again.
So when the Kelly Equation treats your next trade as a fixed probability event, independent and clean, understand that it is solving a completely different problem. Markets carry scars. Kelly does not.
Why the Kelly Equation Fails in Real Trading Again: The Regime Problem
Kelly treats every bet as a fresh start with known odds. Markets repeat their character for months or years at a time.
My 30 year backtest showed win rates changing dramatically between Bull and Correction regimes. Applying one fixed Kelly number across both regimes causes serious damage.
How I Adjusted the Kelly Equation for My Own Strategies
Fractional Kelly became my starting solution. Multiplying Kelly by 0.5 cuts position size and protects against losing streaks.
But the bigger fix was making Kelly dynamic instead of static. Rather than assuming a fixed win rate, I calculate Kelly using a rolling window of the last 20 trades to reflect what the market is actually doing right now.
The inspiration came from Mark Minervini’s progressive approach to position sizing. At the start of a new bull market or when a bear market begins taking hold, he does not wait for a mountain of evidence before adjusting. He reads his recent trade results like a temperature gauge and scales his exposure up or down aggressively based on what the last few trades are telling him.
That idea clicked for me immediately. Your recent trades are not just a performance record. They are a live signal about whether the current market wants to reward your strategy or punish it.
Building a Rolling Regime From Your Last 20 Trades
The idea is simple. Your last 20 trades tell you more about current market conditions than your entire backtest history combined.
If 14 of your last 20 trades were losers, the market is telling you something. You should be sizing down, not holding steady because your five year average looks fine.
python
import pandas as pd

def rolling_kelly(trade_log, window=20, fraction=0.5):
    # trade_log is a DataFrame with columns: pnl, win (bool)
    recent = trade_log.tail(window)

    win_rate = recent['win'].mean()
    avg_win = recent[recent['win']]['pnl'].mean()
    avg_loss = abs(recent[~recent['win']]['pnl'].mean())

    edge = (win_rate * avg_win) - ((1 - win_rate) * avg_loss)
    odds = avg_win / avg_loss
    kelly = edge / odds

    return max(kelly * fraction, 0)  # never negative sizing

# Example output
print(f"Current position size: {rolling_kelly(trade_log):.2%}")
The last line caps the output at zero. If your recent edge is negative, the formula tells you to stop trading, not to bet against yourself.
What This Looks Like in Practice
Three inputs drive the calculation at all times: your last 20 trade outcomes, the average size of your wins, and the average size of your losses. When market conditions shift, the Kelly number shifts with them automatically.
This is a small change in code but a significant change in thinking. You stop asking what your edge has been historically and start asking what your edge is right now.
FAQ
What is the Kelly Equation?
The Kelly Equation is a position sizing formula that calculates the mathematically optimal percentage of your account to risk on each trade, based on your historical win rate and risk reward ratio.
What is Expected Value in trading?
EV is your average profit per trade when you repeat the same setup many times.
Why does Kelly break down in bear markets?
Bear markets could persist for years because momentum compounds losses. Kelly assumes each trade resets independently.
What is fractional Kelly?
Fractional Kelly multiplies your full Kelly output by 0.25 to 0.5, giving you a dynamic position sizing range that scales down during losing streaks and scales up when your edge is confirmed and conditions are in your favor.
Which languages work best for Kelly calculations?
Python and R both handle this well. The core formula fits in under ten lines.
Want to Go Deeper? Everything Lives at StockAITrading.com
I have spent years backtesting breakout strategies, parabolic short setups, and episodic pivot trades across decades of market data. All of that research is documented, tested, and broken down into something you can actually use.
On the site I also write about the thinking behind building a serious backtesting system in Python. The architecture decisions, the mistakes, and what I learned from running real strategies against real data.
And for the parts that used to take weeks to figure out alone, I show exactly how I use AI to shorten that learning curve dramatically. What took experienced traders years to discover, you can now pressure test in days.
If any of this resonates with you, the rest of the work is at StockAITrading.com.